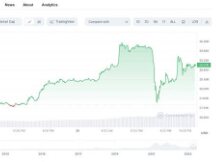
Bitcoin temporarily retreated on the rise as usual.
Bitcoin (BTC) rebounded from a low of $ 29,500 on July 20 to a low of $ 48,200 on August 14.
Currently, BTC profits have remained close to US $ 46,000, and this horizontal market gives altcoins an opportunity to move forward. As you can see in the image below, the total market value of the altcoin market has increased by 80% since July 20. At the same time, Bitcoin holdings have fallen 10% since July 30.

Daily report on Bitcoin dominance and total altcoin market price. Source: TradingView
Although Bitcoin's volatility has risen sharply in recent weeks, according to data from TradingView, a number of altcoin projects have risen due to oversold rebounds in the market, according to input from new phones and contract updates.
DeFi and NFT project high data
Over the past four weeks, projects focusing on non-fungible tokens (NFT) and decentralized funding (DeFi) have been major gains in altcoin.
Our products that recorded the biggest gains over the past month were AXS, Solana (SOL) and Terra (LUNA), which hit all-time highs on August 17th.

4 hour chart AXS / USDT vs SOL / USDT vs LUNA / USDT. Source: TradingView
As you can see above, the price of AXS increased by almost 400%, while LUNA and SOL increased by 340% and 187% respectively.
What's interesting to note is that interest in Solana and Terra started to grow a few days after using the London hard curve on the Ethereum network.
Although the London Fork made some positive changes to the Ethereum network, including the electronic token that could intercept Ethereum, the change did little to address the issue of high exchange rates. This opens up the possibility for competing solutions such as Solana and Terra to gain market share.
IMPORTANT: The Eth2 Staking Contract includes one of the largest parts of Ethereum at $ 21.5 billion.
Analyst announces start of altcoin season
The growth of altcoins has led many traders to predict the arrival of the new altcoin season. According to Twitter analyst "Moon," the altcoin season follows the rise in the value of BTC, especially when the price is stagnant or falling.
As expected, altcoin season is approaching! ! ! ib pic.twitter.com/Od0wef67ga
-Month (@TheMoonCarl), August 11, 2021
Two weeks ago more and more altcoins hit record highs, further proof that the altcoin season has just started. Daily incomes double and prices explode thanks to activities like Audius and memecoins like Dogecoin (DOGE) and Shiba Inu (SHIB) are making headlines, and Crypto Twitter is full of social media discussions about the hottest altcoins. .
Interestingly, despite the positive performance, the altcoin Seasonal Index is actually hitting a two-year low, as seen in the tweet below.
Despite positive gains for altcoins over the past 30 days, the periodic altcoin index (90 days) is the lowest in two years. What are the future projects? https://t.co/EbbDVymYJ5 pic.twitter.com/MjaTjU6zXM
- Holger (@rohmeo_de) August 16, 2021
What this means in the long term needs to be explained, but the optimistic view is that the rebound in altcoin over the past two weeks is just a prelude to the altcoin term, and the true era of altcoin. has not yet started.
So far, Bitcoin is still an important market indicator that determines the future direction of the entire crypto industry, but data shows that the joint venture gives more room to altcoins to climb higher.
If the price of Bitcoin falls below $ 40,000, most analysts expect the price of altcoin to move south as well. A return greater than $ 48,000, on the other hand, can increase the value of the altcoin.
Traders analyze quadratic and rectangular digits to see the volatility and trade of cryptocurrencies over time. A bull market occurs when demand exceeds commodity, and a bear market occurs when sellers pass buyers. More markets are created when bulls and bears take their place.
Sometimes this creates a rectangular structure which can best be described as a crowded area or a crowded area. Bearish and bullish rectangles are generally considered continuous patterns, but in many cases they follow an inversion pattern to mark the completion of a wider top or bottom.
Before going into more detail on bullish and bearish rectangles, let's talk about how to identify them.
Basic knowledge of rectangular structures
When a property is made up of two or more matching vertices and two bottoms that are roughly at the same level, a rectangle is created. You can use two wires to connect the ups and downs as protection and support.
The length of the rectangle varies from a few weeks to several months, and if this period is less than 3 weeks, it is considered a sign. In general, the longer the tools are used to assemble, the greater the risk of shock or breakage.
Accentuated Rectangle Pattern

Accentuated rectangular structure. Source: TradingView
The first reaction was bullish as some bulls took advantage of the rally after the asset saw an increase as noted above. After adjusting the price, more affordable purchases prevented a decline in purchases and created the first low.
When demand exceeds the commodity, the asset will try to resume its uptrend, but when the price hits its previous reaction, the trader will profit more. Connect these two high points with a straight line to create a rectangle. When prices fall, buyers resist the initial low reaction rate that creates support.
It is difficult to predict the direction of a crash and the cost can vary from support and resistance to weeks or months. For this reason, it is best to wait for the price to come out of the rectangle before indicating a bullish or bearish signal.
In the example above, when demand is greater than product, cost breaks the resistance of quantity. This may cause the upgrade to restart.
bearish rectangular structure

Bearish rectangular structure. Source: TradingView
As you can see in the example above, real estate has risen sharply, but when prices reach levels that traders see as worthless, sellers sell have absorbed the material, creating a low rate of reaction. The bulls have tried to change direction but sentiment remains negative and traders sell off the competition creating a strong backlash.
When the price hits the low of the first reaction, traders have rebounded from the downtrend, but the short stop is close to the previous high reaction. The values are added by the connecting lines to form a rectangle.
A bearish rectangular pattern is achieved when the value crosses below maximum support and closes. This usually leads to a restart of the downtrend.
rectangular structure of bullish continuation

THETA / USDT calendar. Source: TradingView
THETA rallied before finding resistance near $ 0.80 on September 30, 2020. On the downside, buyers were hit and deviated near $ 0.55. Since then, prices have been between these two levels until December 15, 2020.
The THETA / USDT pair broke the rectangle on December 16, 2020, indicating that the bulls have overtaken the bears. This indicates a resumption of promotions.

THETA / USDT calendar. Source: TradingView
Calculate the height of the rectangle to hit the target in the rectangle. In the above case, the height is $ 0.25. Add this value to the distribution level of $ 0.80 in the example above. This works out to a goal of $ 1.05.
If the uptrend resumes after a long period of unification, it may be above target, as in the above case. Traders can use the target as an indicator of use, but should consider the strength of the pattern and signals from other symbols before deciding to close a position or provide trade participation.
The same technique applies to the bearish rectangle as shown below.

LTC / USDT calendar. Source: TradingView
Litecoin (LTC) fell from US $ 184.98 on May 6, 2018 to US $ 73.22 on June 24, 2018. Buyers have entered this level and are trying to build below, but support non-stop yield and $ 90 stop on July 3. , 2018. Since then, the LTC / USDT currency pair has maintained many movements of these two levels until August 6, 2018.
The bears reconfirmed their rule on August 7, 2018 and pulled the price below the rectangle. This is the return of the downtrend.

LTC / USDT calendar. Source: TradingView
In a falling rectangle, the objective post-decomposition is calculated by subtracting the height of the rectangle from the decomposition point. In the example above, the height of the rectangle is $ 17. Subtract $ 73 from the payout level to reach the goal of $ 56.
Rectangle inverted man

ETH / USDT calendar. Source: TradingView
Ether (ETH) traded lower, rising to $ 1,440 in January 2018 and reaching $ 81.79 in December 2018. This level led to good buying of bulls and ETH / USDT currencies . The couple are happy again. However, the drop will come back and close to $ 300 by June 2019. Since then, the couple have been in the middle of these two stages until July 24, 2020.
The bull pushed the price higher than the square on July 25, 2020, marking the start of a new breakout. The bears attempted to push the price below the $ 300 breakout level, but failed. This shows that market demand is changing for the better and traders buy when there is a downturn. The pair resumed their highs in November 2020.
While the target for the model to break out of the rectangle was only US $ 518.21, the pair rose in May to a high of US $ 4,372.72.
values
Rectangle mode is a useful tool because it can be used in stretch mode or in reverse mode. A large rectangle allows traders to be near support and sell near resistance.
In order to improve the quality of the rectangle and not become a top, traders can wait for the price to break and maintain the top or bottom pattern before opening the position. This is because the costs may be higher than the target expectation when crossing a long rectangle.

Scan QR code with WeChat


